4.5. nabling and Visualizing Point Cloud in ROS 1
This section demonstrates how to enable point cloud data output from the camera node and visualize it using RViz.
4.5.1. Enabling Depth Point Cloud
4.5.1.1. Command to Enable Depth Point Cloud
To activate the point cloud data stream for depth information, use the following command:
roslaunch orbbec_camera gemini_330_series.launch enable_point_cloud:=true
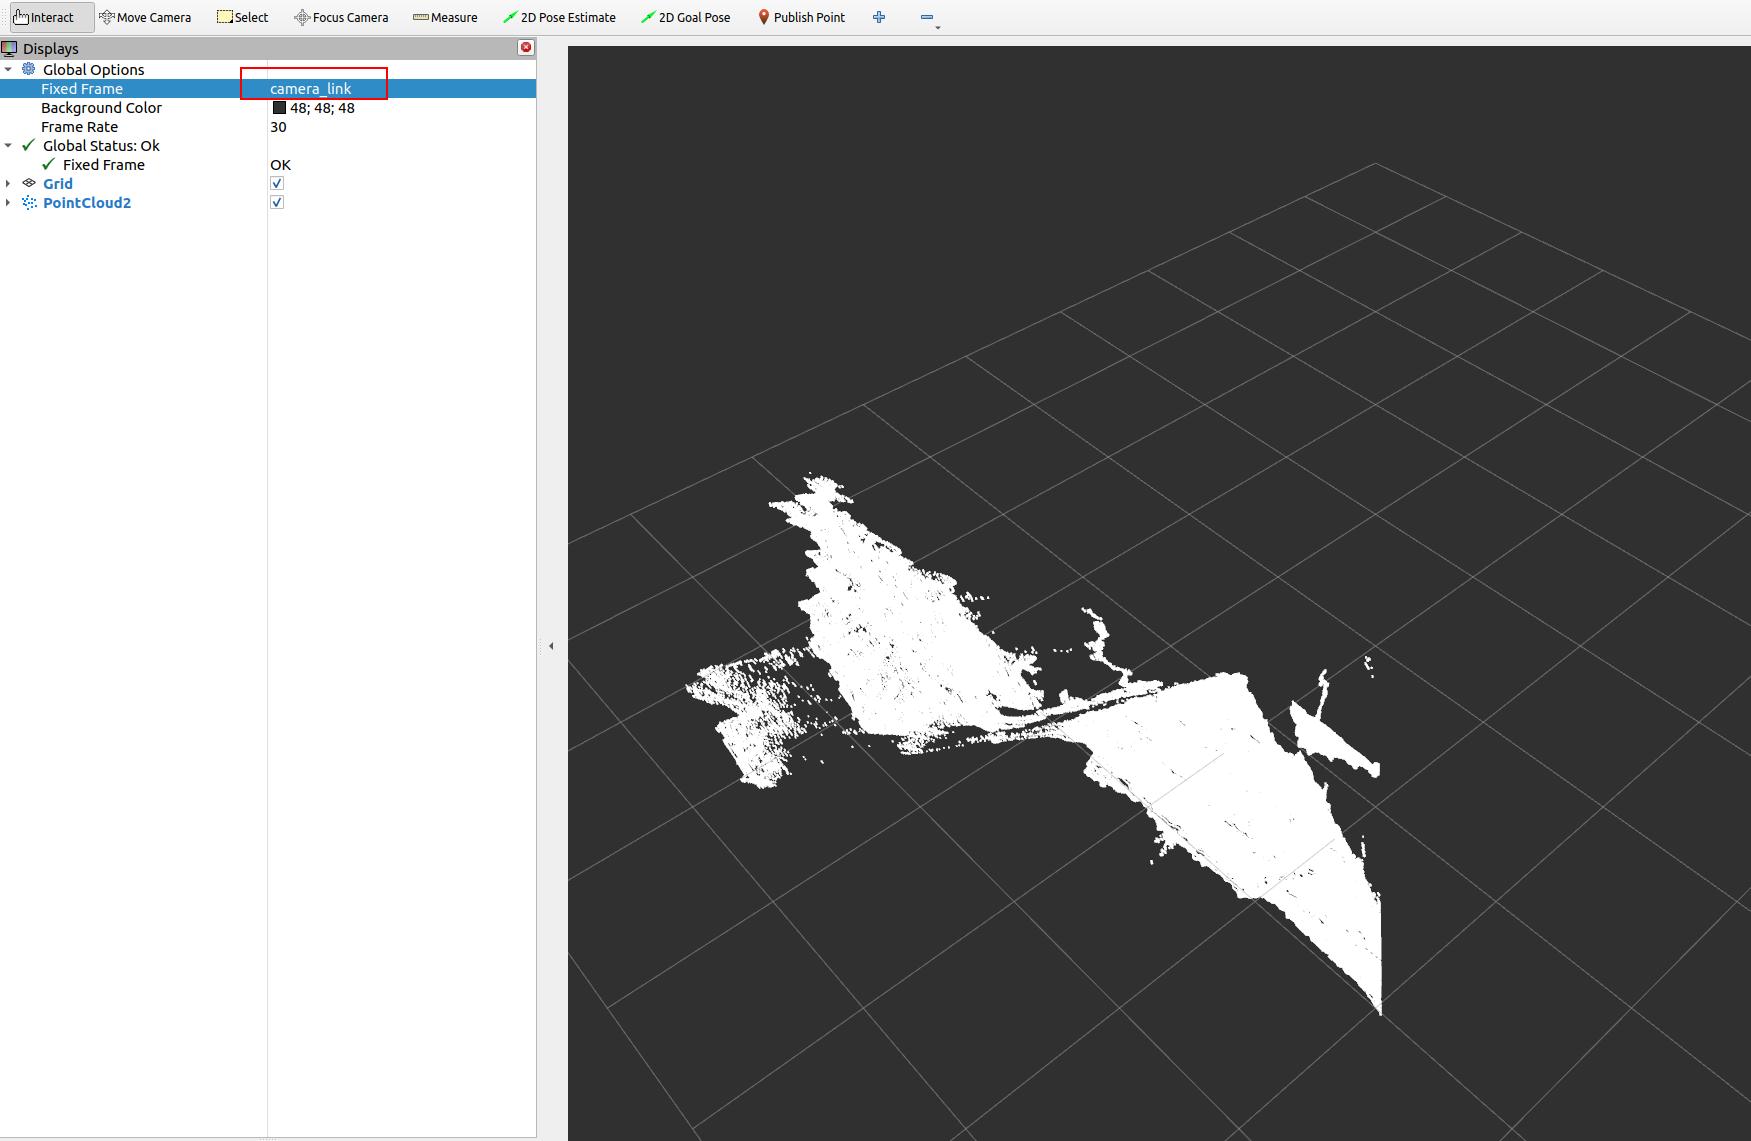
4.5.1.2. Visualizing Depth Point Cloud in RViz
After running the above command, perform the following steps to visualize the depth point cloud:
Open RViz.
Add a
PointCloud2display.Select the
/camera/depth/pointstopic for visualization.Set the fixed frame to
camera_linkto properly align the data.
Example Visualization
Here is what the depth point cloud might look like in RViz:
4.5.2. Enabling Colored Point Cloud
4.5.2.1. Command to Enable Colored Point Cloud
To enable the colored point cloud feature, enter the following command:
roslaunch orbbec_camera gemini_330_series.launch.py enable_colored_point_cloud:=true
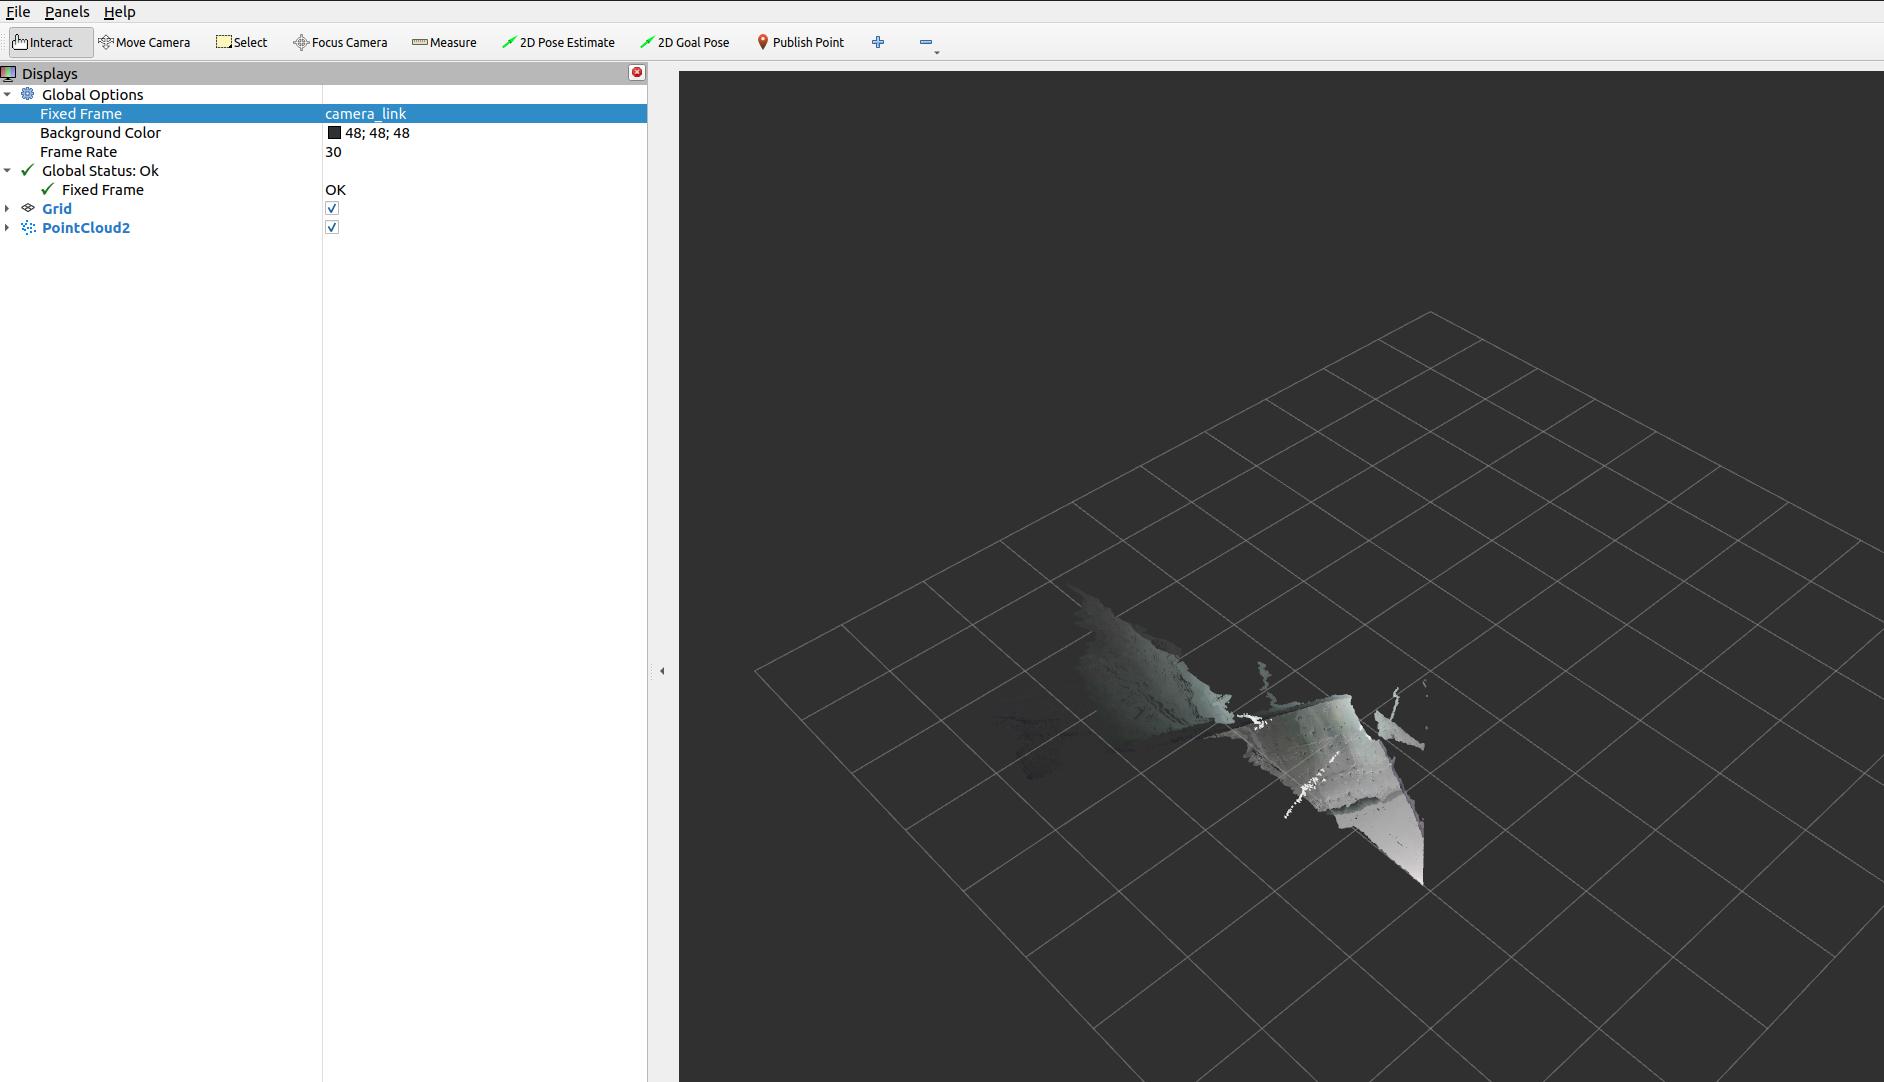
4.5.2.2. Visualizing Colored Point Cloud in RViz
To visualize the colored point cloud data:
Launch RViz following the command execution.
Add a
PointCloud2display panel.Choose the
/camera/depth_registered/pointstopic from the list.Ensure the fixed frame is set to
camera_link.
Example Visualization
The result of the colored point cloud in RViz should look similar to this: