6.5. Performance Benchmark Tools
This section introduces the performance benchmark tools, their purpose, and the metrics they help measure.
6.5.1. common_benchmark_node.py
common_benchmark_node.py monitors Orbbec camera performance in a ROS environment. It collects and records subscriber-side metrics such as image frame rate, latency, system resource usage, and estimated frame loss to help evaluate camera node stability and performance. Statistics are updated once per second.
Features:
Measures the frame rate and latency of images received by the subscriber (current, minimum, maximum, and average).
Monitors camera node CPU/ARM usage (current, minimum, maximum, and average).
Estimates subscriber-side frame loss from image message timestamps.
Supports
color,left_color,right_color,depth,ir,left_ir, andright_irimage streams, as well as compressed image and point cloud topics.Prints real-time statistics at 1 Hz and saves results to a CSV file.
Supports configurable runtime, CSV output path, camera names, and topics.
The node estimates subscriber-side frame loss from adjacent image message timestamps. When --ideal_fps is set, it uses the specified ideal frame rate; otherwise, it learns the nominal frame interval from received image timestamps.
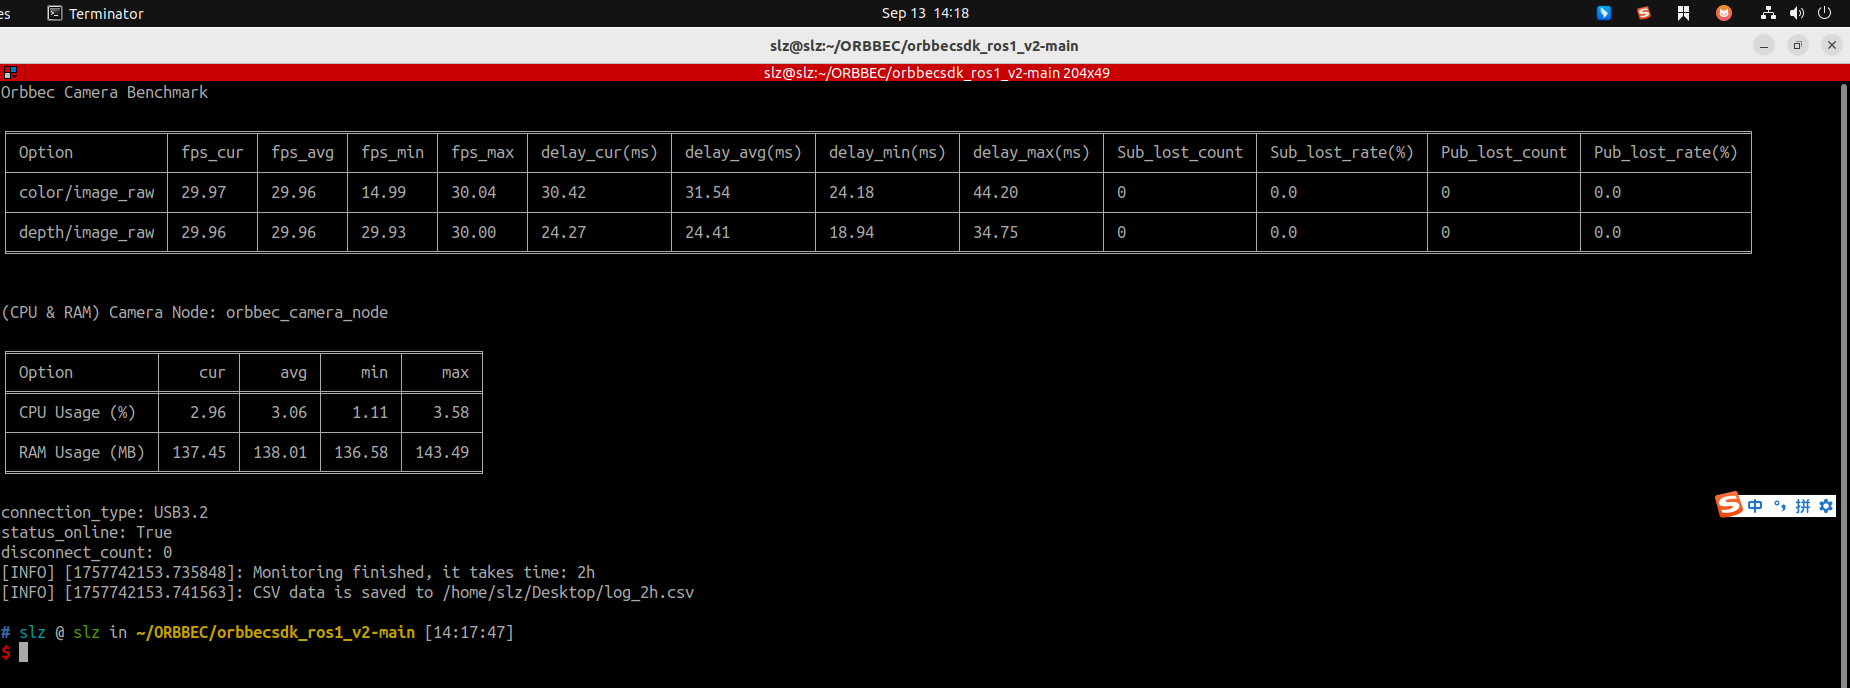
Run with default settings:
rosrun orbbec_camera common_benchmark_node.py --run_time 30s
Run with a custom CSV output path:
rosrun orbbec_camera common_benchmark_node.py \
  --run_time 2h \
  --csv_file /path/to/log.csv
Multi-camera monitoring example:
rosrun orbbec_camera common_benchmark_node.py \
  --run_time 1h \
  --csv_file /tmp/cam_log.csv \
  --camera_names camera,camera01 \
  --topics color,left_color,right_color
Parameters:
--run_time/_run_time: Monitoring duration. Supported formats include10s,5m,1h, and2d. The default is10s.--csv_file/_csv_file: Output CSV file path.--camera_names/_camera_names: Camera name list, separated by commas.--ideal_fps/_ideal_fps: Ideal frame rate used for subscriber-side frame-loss estimation. A value greater than0overrides the interval learned from image timestamps.--topics/_topics: Topics to monitor, separated by commas. Use raw stream names such ascolor,left_color,right_color, or full raw/compressed image and point cloud topics. Automatic discovery selects only raw image topics; compressed images and point clouds require full topic names.
6.5.2. service_benchmark_node.py
service_benchmark_node.py monitors service call performance. It calls multiple services from a YAML configuration file and reports call count, success rate, average time, minimum time, and maximum time.
Features:
Benchmarks multiple services defined in a YAML configuration file.
Builds requests automatically from the active ROS service type.
Can save benchmark results to a CSV file.
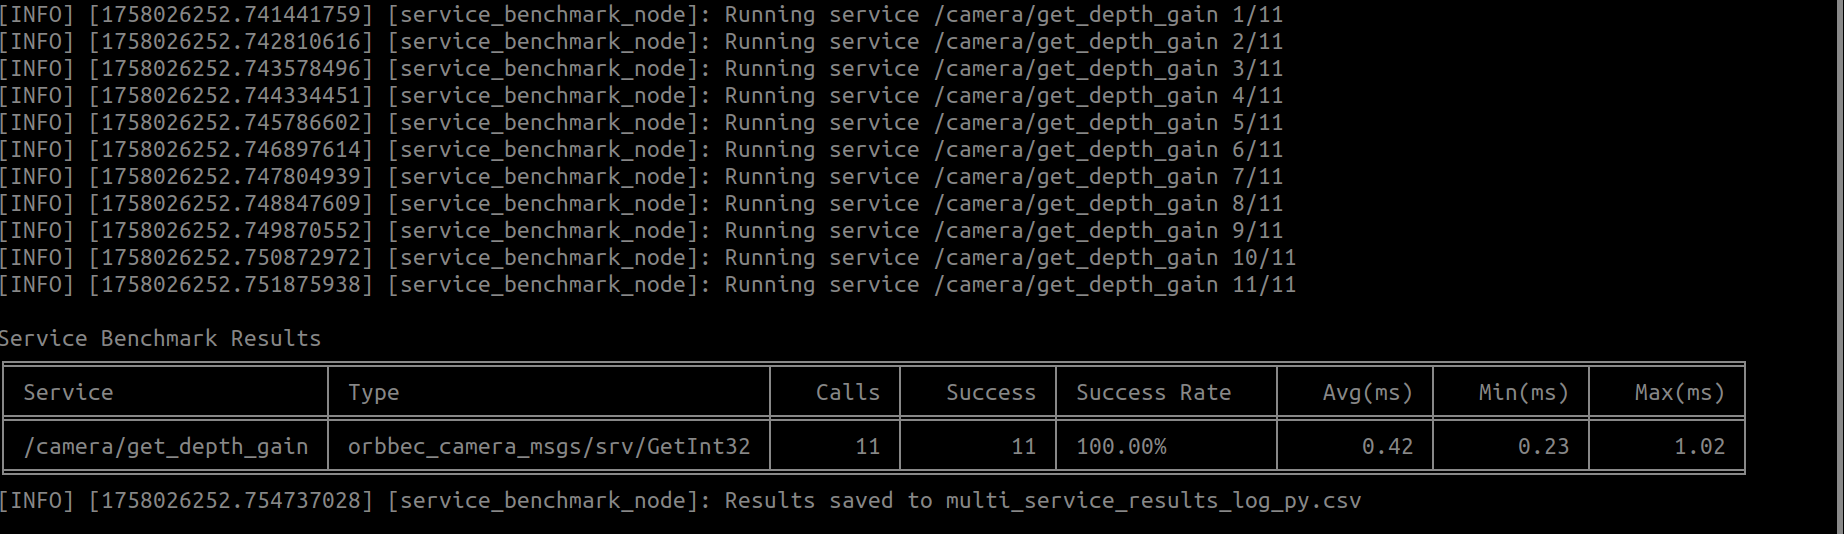
Multiple services benchmark (YAML configuration + CSV output):
rosrun orbbec_camera service_benchmark_node.py \
  --yaml_file /path/to/default_service.yaml \
  --csv_file /path/to/results.csv
The example YAML configuration is available at scripts/default_service.yaml. default_count is used when an entry does not specify its own call count.
6.5.3. service_benchmark_node
service_benchmark_node is the C++ service call benchmark tool. The Python version, service_benchmark_node.py, is recommended for most cases because it can batch-test services from YAML and write CSV output.
Single service benchmark:
rosrun orbbec_camera service_benchmark_node \
  _service_name:=/camera/set_color_ae_roi \
  _service_type:=orbbec_camera/SetArrays \
  _request_data:='{data_param: [0, 1279, 0, 719]}'
Multiple services benchmark (YAML configuration):
rosrun orbbec_camera service_benchmark_node \
  _yaml_file:=/path/to/default_service.yaml
6.5.4. Benchmark Recommendations
Start with a small service set to verify network and device stability, then expand to the full service list.
For long runs, write
--csv_fileto a persistent directory.Archive results by device and date for trend analysis.
If abnormal latency appears, inspect the
/camera/device_statustopic together with the benchmark result.
For a complete service YAML example, see scripts/default_service.yaml in the source tree.